Merge Queue Throughput Benchmarking for Software Factories
Merge queue performance now has measurable levers that most teams have never instrumented.

Merge queue throughput is a production metric now, not a vague sense that "CI feels slow." It has specific inputs, a known ceiling, and a set of levers that most platform teams have never measured directly, mostly because the gap between "CI passed" and "safely merged" has almost no instrumentation attached to it. Telemetry on AI-assisted development shows why this matters more by the quarter: task throughput per developer is up sharply, but median time in code review has climbed even faster, and bugs per developer are rising too. Generation got faster. Verification did not. This piece lays out what actually governs merge queue throughput, what a large benchmark dataset says about where teams sit today, and how the math changes once a meaningful share of PRs come from agents instead of people.
What the merge queue actually controls and why it serializes
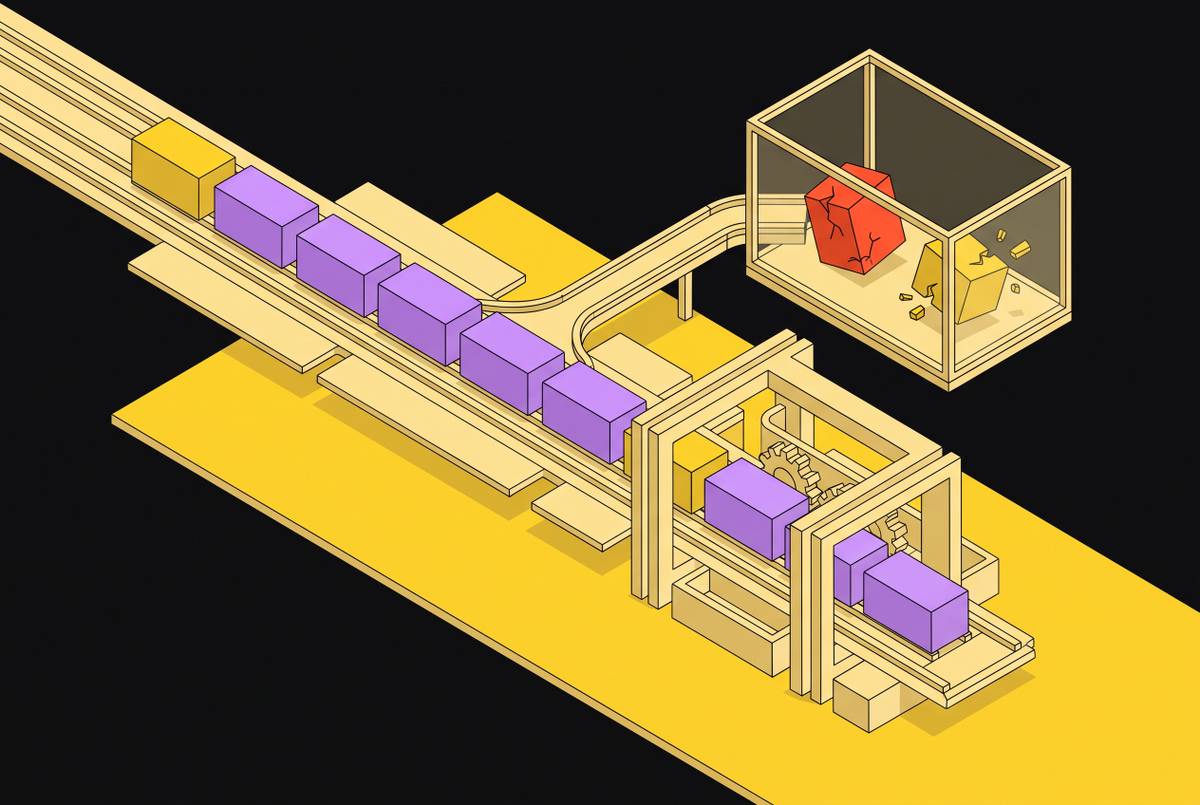
A merge queue exists to enforce one invariant: every pull request gets tested against the real future state of main, meaning the current tip plus everything already queued ahead of it, not the stale branch point where the PR was originally written. That sounds like a technicality. It isn't.
Without a queue, a PR passes CI against its own branch, looks clean, merges, and then breaks main because the codebase moved underneath it while the PR sat waiting. Call it a stealth merge. The code was correct against a version of reality that no longer existed by the time it landed. A queue closes that gap by testing against a predicted future state instead of a stale one, and that guarantee is exactly what makes the queue expensive: catching a "green-on-stale" regression before it reaches main requires serializing work that would otherwise run in parallel.
Do the arithmetic on a serial queue with a 30-minute CI suite, and the ceiling comes out to roughly 48 PRs a day, full stop. Every minute added to the test suite subtracts directly from that number. And in a monorepo, the ceiling is usually worse than the math suggests, because unrelated changes (a frontend tweak, a backend migration, an infra config change) end up blocking each other in the same serial line for no reason connected to the actual risk of collision.
When a batch does fail, the queue has to bisect to find the culprit, which means additional full CI runs on the order of log(n) for a batch of n PRs. Worse, every PR queued behind the failure point now has to be retested against a new speculative state, because the state they were originally tested against no longer holds. This cascade has almost nothing to do with code quality. A single flaky test, one that fails intermittently on otherwise fine code, invalidates the speculative state for every PR behind it in line. Flake rate, not defect rate, is what drives the cost of a failed batch.
There's a name for the mechanism that catches this before it reaches main: a diamond merge, where the queue pulls a failed batch apart to isolate the actual culprit. Data on merge queue behavior puts this happening on 5.1% of private merges and 1.1% of open-source merges, meaning the queue is doing real, measurable work catching breaks that would otherwise have landed. Throughput, latency, and failure rate are all downstream outputs of these mechanics. None of them improve by optimizing what happens before a PR reaches the queue.
The primary benchmark dataset and what it actually measures
The most comprehensive public dataset on queue behavior comes from a State of Merge Queues report published July 27, 2026, drawing on more than 200,000 merges across 477 organizations over a rolling 90-day window. Filtered down to repositories with at least ten merges and two distinct human authors, the benchmark set narrows to roughly 160 organizations and about 153,000 merges.
The filter matters more than it looks like it should. Automated PRs, the kind opened by dependency-update bots, clear the queue in about 0.4 minutes on average. Human PRs take roughly 12 minutes. Blend the two together in a single throughput number and the result flatters every team running a lot of bot traffic, which is most teams, which is why the filtered set exists in the first place.
What this dataset actually captures is the stretch of the pipeline between "CI passed" and "safely merged," a gap almost nobody instruments because almost nobody has queue-level telemetry to begin with. It does not capture teams running without a queue at all, it does not capture pre-queue CI duration, and it says nothing about the composition of the agent fleet generating the PRs it counts. Worth naming directly: autonomous, agent-authored PRs are still a rounding error in this dataset, a few hundred merges out of 153,000. These figures describe today's AI-assisted reality, where humans are still the ones opening most pull requests with an agent's help. They are not a picture of a fully agentic future.
The four inputs that set your throughput ceiling
Throughput isn't a dial. It's an output of four inputs interacting with each other, and benchmarking one without the others produces a number that's technically true and practically useless.
Test suite duration sets the floor. Thirty minutes of CI on a serial queue caps output around 48 PRs a day, and every added minute comes straight out of that ceiling. A two-stage CI setup, lightweight checks on every push and the full suite reserved for queue-ready PRs, cuts wasted compute without touching the underlying suite duration at all. Plaid's own baseline measurement found queue overhead alone, with no CI running yet, at roughly 40 seconds per merge. That number is worth having before touching anything else, because it tells you what the queue costs independent of what runs inside it.
Flake rate is the quiet one. A single intermittent failure invalidates every speculative state queued behind it, and the cost of that cascade scales with how deep the queue is, not with how bad the flake is. Flake rate has to be tracked separately from ordinary CI failure rate: a test that fails 10% of the time on code that's perfectly fine isn't a quality signal at all. It's a throughput tax, and it shows up nowhere on a standard CI dashboard.
Runner capacity decides whether batching pays off. Batching multiple PRs into one CI run only multiplies throughput if the runner fleet can actually absorb the parallel speculative builds that batching requires. Capacity headroom isn't something to add later, it's a prerequisite. Watching where self-hosted runner budget actually goes, and which jobs are burning capacity without contributing to throughput, is a measurement problem on its own. At agent scale this gets harder to predict, not easier: bursty PR arrivals push utilization toward the steep, expensive part of the queueing curve, the part where small increases in load produce disproportionate increases in wait time.
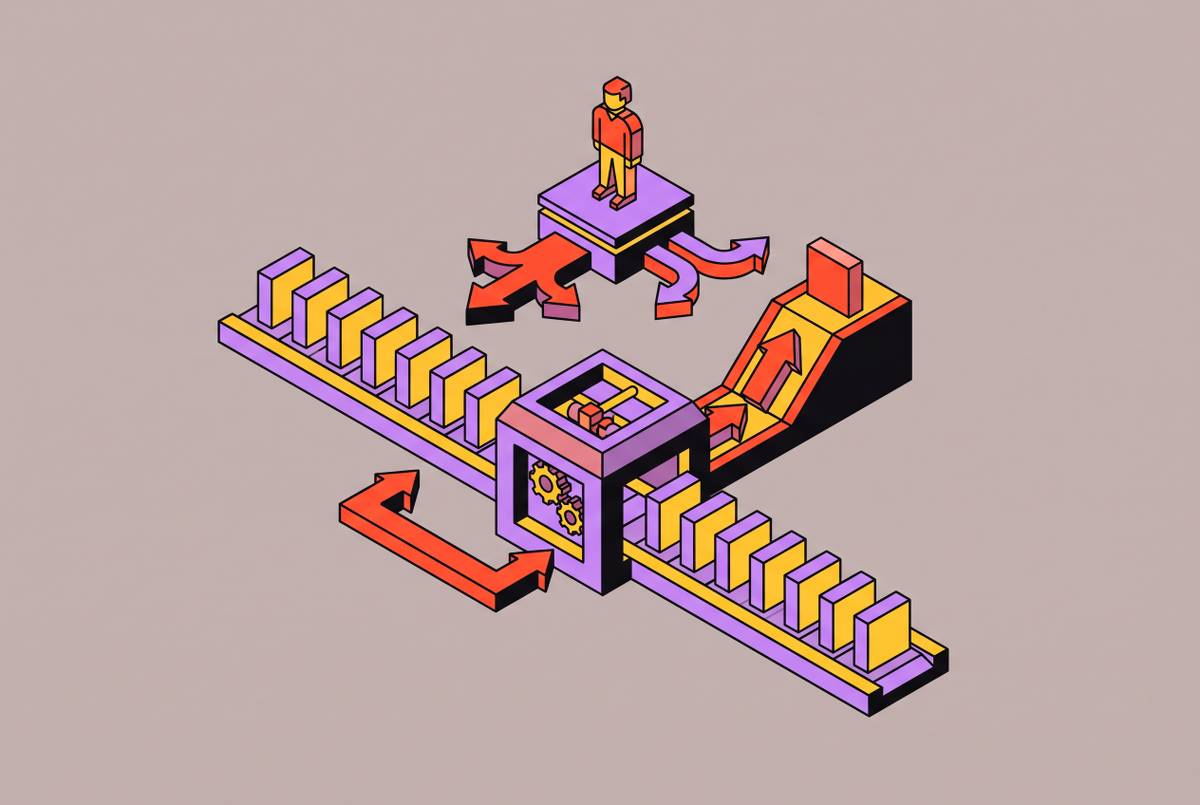
Queue mechanics decide how much of that capacity gets used well. Batching tests several PRs together in one CI run and merges them as a group if it passes, multiplying throughput by roughly the batch size when things go right. And yet 94% of teams still merge one pull request at a time instead of batching. Only a small fraction ride in a batch, averaging four PRs each. That's a lot of unclaimed throughput sitting on the table industry-wide. Parallel queues with scope-based lanes solve a related but distinct problem: unrelated changes, say a CSS fix and an API migration, merge independently instead of one blocking the other. Speculative checks handle the dependency case, building a predicted future state when PR #3 depends on #1 and #2 succeeding, and testing against that prediction instead of waiting in a single serial line.
What broken-main rate reveals about team size and queue necessity

Broken-main rate scales with team size almost exactly the way queueing theory predicts it should, and the scale of the effect is large: roughly 0.77% at 2 to 5 engineers (about 1 in 130 merges), climbing to 12.5% at 40 or more engineers (about 1 in 8). That's a sixteen-fold increase. The intermediate points, 0.98% at 6 to 15 engineers and 2.49% at 16 to 40, show the curve bending right where teams usually start feeling merge pain in the first place, long before anyone's run the numbers to explain why.
The mechanism is not subtle. More engineers means more PRs in flight at once, which means more chances that two individually correct changes both touch the same underlying assumption without either author knowing about the other. It's math, not a commentary on code quality.
Private repositories break main 4.5 times more often than open-source ones (5.1% versus 1.1%), which tracks with private codebases tending to have more interdependent, tightly coupled code where collisions are more likely. When a batch does fail on a private repo, it bundles about 6 PRs on average, meaning one bad change can stall five perfectly good ones sitting behind it in the queue. Queue time itself scales the same way: sub-minute under 15 engineers, roughly 11 minutes at 16 to 40, roughly 18 minutes at 40 or more.
Below about 15 engineers, most teams get by fine without a merge queue at all. Above that line, "green PR, broken main" stops being a curiosity someone mentions in standup and becomes a standing tax, one that grows with every hire and, increasingly, with every agent added to the fleet. Worth noting for anyone trying to baseline what "normal" should look like going forward: AI-assisted PRs broke main 1.9% of the time within these repositories, versus 4.4% for unassisted PRs. That gap deserves more scrutiny than it's gotten, but at minimum it argues against the assumption that more AI-generated code automatically means more breakage.
The Plaid monorepo case: from baseline measurement to throughput optimization

Plaid's monorepo, across 2025 and 2026, gives a concrete look at what fixing this actually involves. Early in 2025, the team was seeing multiple breakages a month, each costing hours of engineering time to track down, and some traced back to diamond merges, the exact failure mode a queue exists to catch.
The first step wasn't a fix. It was a baseline. In June 2025, Plaid introduced a merge queue in no-op mode, purely to measure overhead before layering in any CI logic, and found the queue itself cost roughly 40 seconds per merge before a single test ran. That number became the reference point for everything after.
The second step went the wrong way on purpose, in the useful sense. A "build everything" configuration, testing every affected system on every PR, pushed median merge queue duration up to roughly 6 minutes, with the p95 exceeding 12. That was expensive, but it was informative: it made test suite duration and runner capacity visible as the actual binding constraints, rather than abstract concerns.
The third step was scope tightening, reducing what triggered a full build rather than adding more runners to absorb the load. By late August, median merge queue time was down to 1.8 minutes and has stayed stable since. Plaid now runs roughly 700 commits a week, with only minutes separating commits during peak hours.
The sequence is the lesson. Throughput improved because each input, queue overhead, CI duration, build scope, got measured on its own and tuned in order of expense, not because the queue was treated as a black box to be poked at until numbers looked better. What the sequence doesn't cover is worth flagging too: no public breakdown of how much flake rate contributed to that early p95 tail, no detail on AI-assisted PR mix, and no account of how the queue held up as PR volume kept growing. Teams applying this method elsewhere should expect to fill in those gaps themselves.
Reading throughput and latency numbers against industry baselines
Against the filtered benchmark set, the median repository merges roughly 3 PRs per active day through its queue. The top 10% of repositories push 13 or more. Median PR latency in queue sits around 7 minutes, and 90% clear within an hour, even on larger teams where contention would reasonably be expected to build up and slow things down.
The batching gap shows up again here: 94% of private merges still go through one at a time, which means most teams sitting at the median throughput number aren't hitting a hard ceiling, they're leaving batching on the table. That's a solvable problem, not a structural one.
Splitting bot traffic from human traffic matters for any of this to mean something. Automated merges clear in about 0.4 minutes; human PRs take about 12. A blended number that doesn't separate the two isn't a benchmark, it's noise with a percentage sign on it.
A methodological note worth carrying into any internal benchmarking effort: a separate multi-pipeline study logged activity across three merge pipelines over 89 days, covering 670 failing and 4,000 passing builds, and deliberately excluded infrastructure disruption days and holiday periods from the window. That's the right instinct. A benchmark window that includes a week of outages or a holiday lull tells a team less than nothing, it actively misleads.
Translating all this into a read on your own numbers: throughput under 3 merges per active day — the median in the benchmark dataset — suggests a team may be running a serial queue with no batching, or contending with a flake problem quietly suppressing output. A p95 latency well above the benchmark norm is more likely a CI duration or runner capacity problem than a queue mechanics problem, so check suite length and runner headroom before reconfiguring batch logic. And a broken-main rate that significantly exceeds the benchmark range for small teams is worth investigating directly, since the data shows rates well below 1% are typical at that size. Something's off, likely branch staleness or a queue that isn't actually testing against a predicted future state the way it should be.
How agent-driven PR volume changes the benchmarking inputs
At least 1 in 7 private merges already involve AI assistance by current counts, and that figure is a floor, since most tooling leaves no trace of AI involvement in PR metadata at all. Merged pull request volume grew 23% year over year per GitHub's 2025 Octoverse report, tracking directly with AI-assisted coding scaling up across the industry. Separately, Research into AI agent capabilities has found that the complexity of tasks agents can complete autonomously has been growing rapidly, a trend that points toward autonomous PR volume growing as a matter of course, not a maybe.
Each of the four throughput inputs gets stressed differently once agents are generating a meaningful share of PRs.
Test suite duration stops being the only cost that matters, because arrival patterns change shape. Agents open PRs in bursts triggered by events, not by the rhythm of a human workday, which increases variance in arrival rate and pushes utilization toward the steep, punishing part of the queueing curve rather than the flat part where most capacity planning assumes a fleet operates.
Flake rate goes from annoyance to bottleneck. Agent-generated PRs arrive faster than any human triage process can absorb flake-caused rejections, so a flake rate that cost a team a few minutes of irritation a week at human pace starts costing real throughput once PR volume scales past what a person can manually review.
Runner capacity planning based on historical averages quietly stops working, because bursty agent output understates peak demand when averaged over a week or a month. Fleet-level capacity tracking has to replace the older habit of estimating load per engineer, since one engineer directing several parallel agents no longer maps cleanly to a single stream of PRs.
Queue mechanics get more valuable, not less. Scope-based lanes matter more as agent PRs start clustering by task type, dependency updates, mechanical refactors, generated boilerplate, rather than by feature the way human PRs tend to. Those scopes can be driven off the build graph or off file patterns, giving the queue a way to isolate categories of change that don't need to block each other.
Underneath all of this sits a bigger shift in what gets measured at all. Per-engineer metrics stop describing the system once one developer is directing several agents in parallel. At that point a per-engineer count describes the director's activity, not the system's actual output, and the two can diverge sharply. DORA's five measures, change lead time, deployment frequency, failed deployment recovery time, change fail rate, and deployment rework rate, still describe pipeline stability well. But software factory metrics need to describe the combined agent-and-human system as a whole, not just the human half of it.
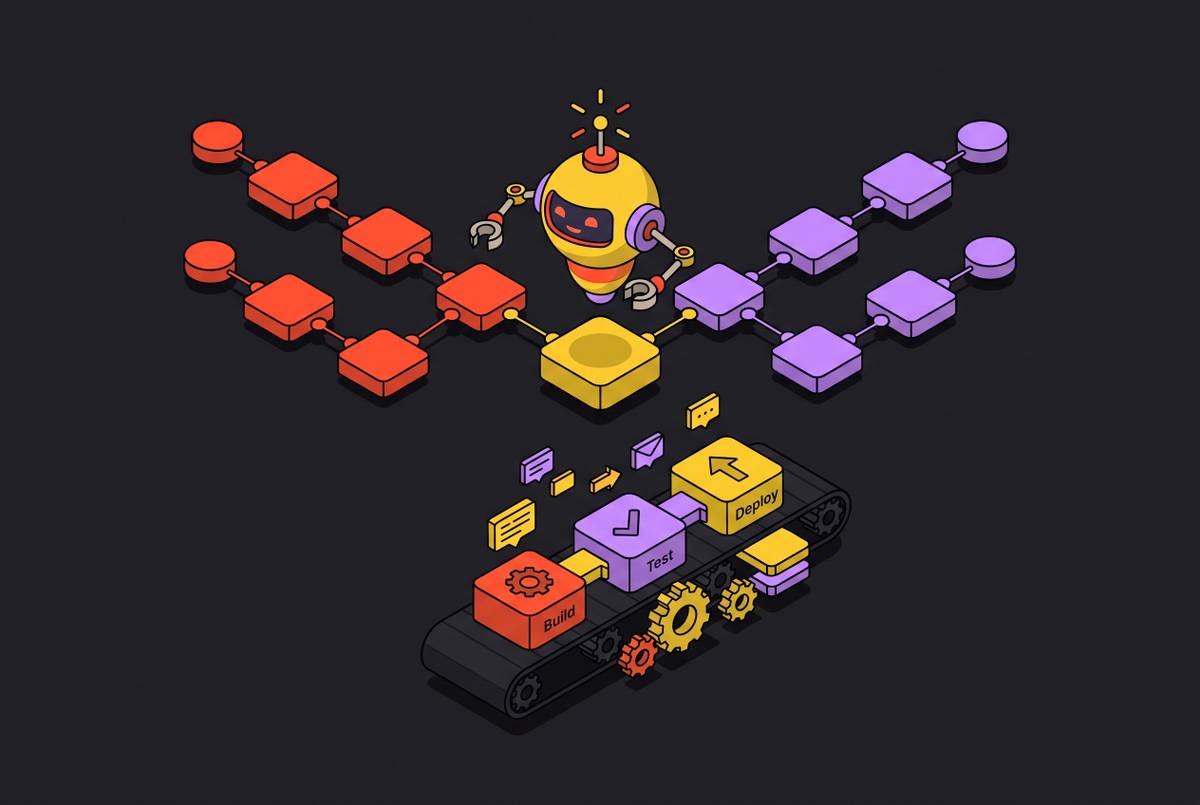
Cloudflare's approach to review capacity is one working illustration of scaling the verification side to match. Their setup coordinates up to seven specialized review agents, covering security, performance, code quality, documentation, release management, and compliance, under a single orchestrator, logging 131,246 runs across 48,095 merge requests in 5,169 repositories in a single month of production use. Whatever the specific configuration, the direction is the same one the rest of this piece points to: generation capacity scaled first, and verification capacity has to scale to match it, or the merge queue absorbs the entire gap between the two.