Engineering Velocity Metrics That Account for AI Agent Contributions
Traditional velocity metrics hide AI-generated code decay behind inflated output numbers.
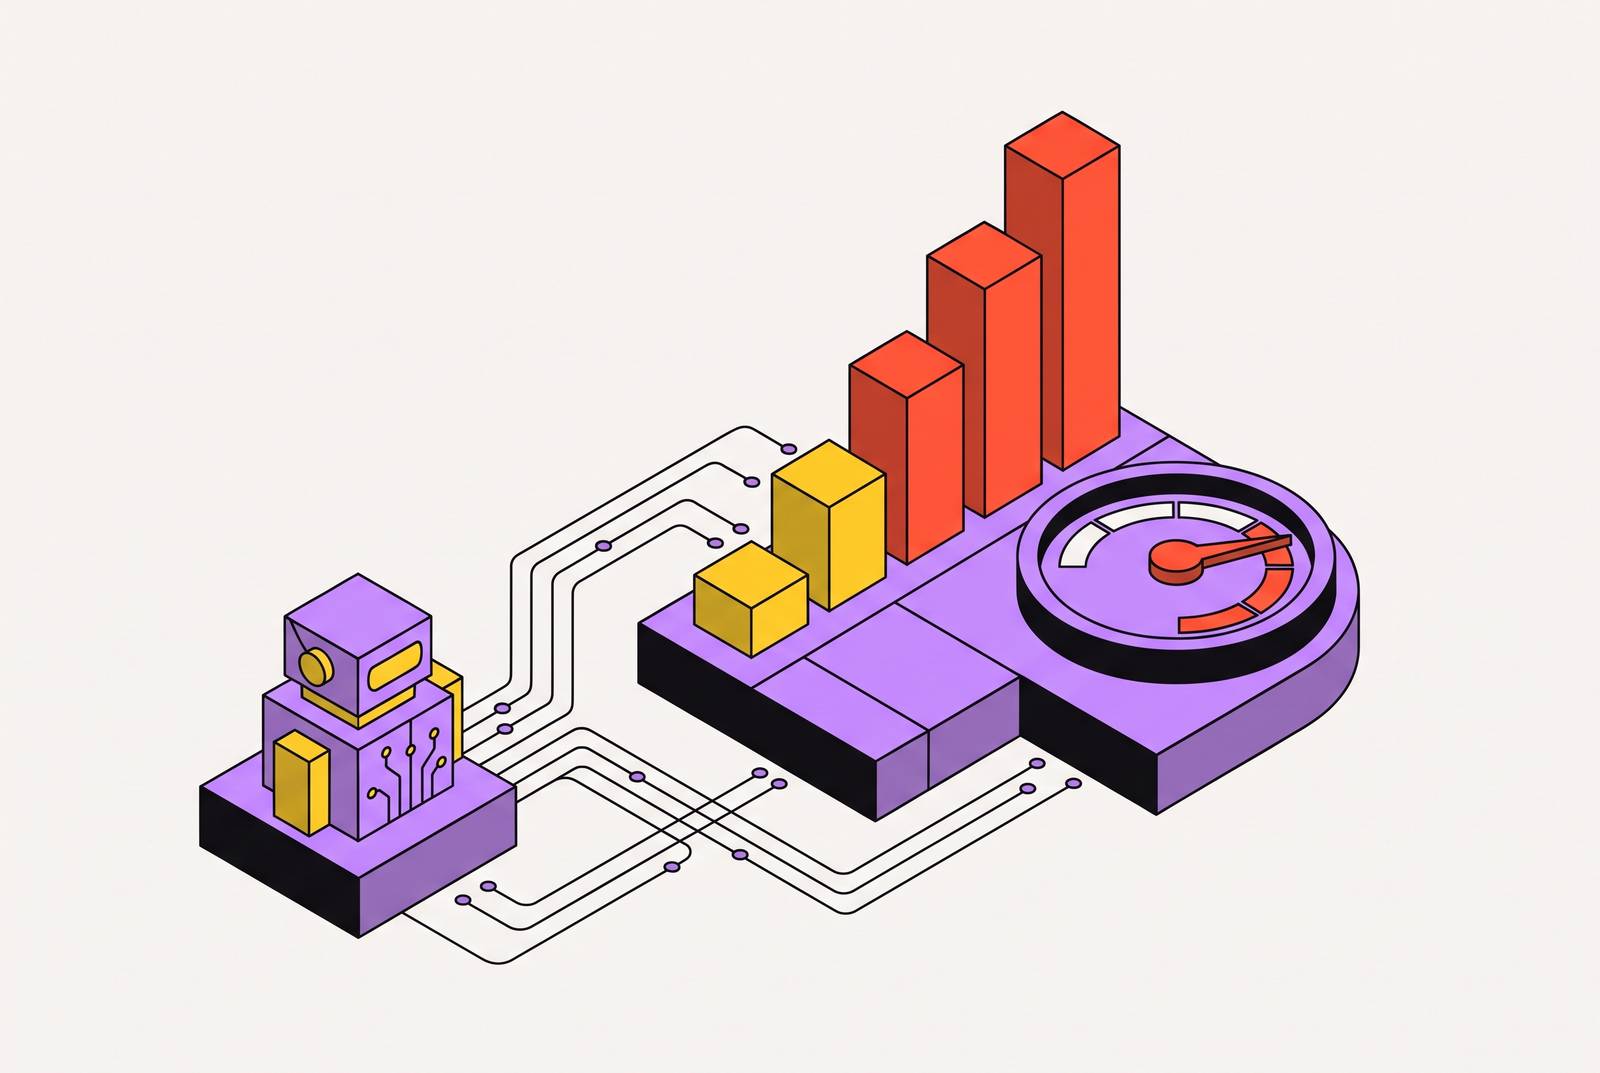
Traditional velocity metrics conflate volume with value, and AI agents expose that flaw at a scale no engineering team has had to confront before. Code churn is caused by agent-generated rework, and it is the clearest early sign that something has gone wrong under the surface. GitClear data cited in recent benchmark work shows churn rising sharply from its pre-AI baseline through 2024 and 2025, which tells a plain story: more code shipped faster does not mean more value delivered faster. Stripe's internal coding agents, called Minions, merge more than 1,300 pull requests a week containing zero human-written code, with humans reviewing before each merge. Every dashboard built on PR counts or commit volume looks better than it should, flattered by a kind of output it did nothing to earn, while the real risk, quality degrading somewhere downstream while leadership watches a velocity chart climb, goes unmeasured until it is someone's problem to fix.
How agent-generated volume hides quality decay
Agent programs tend to follow a recognizable arc, and the danger is that the metrics keep reporting good news well after the news turns bad. In the first quarter, the focus sits on speed: PR counts climb, cycle times shrink on paper, and leadership reads the trend as proof the investment is working. By the second quarter, a different pattern sets in. Developers downstream of the agent start spending more time editing and correcting its output than they would have spent writing the code themselves, yet the dashboard still shows velocity rising, because the dashboard was never built to see the rework happening behind it. That lag, the stretch of time between when an agent generates code and when its problems appear in production, is exactly the window a raw throughput number cannot see into. None of this is a tooling failure so much as a measurement failure: the gap between what's generated and what's actually durable never appears on the panel most teams are watching.
The replacement metrics in a layered measurement framework
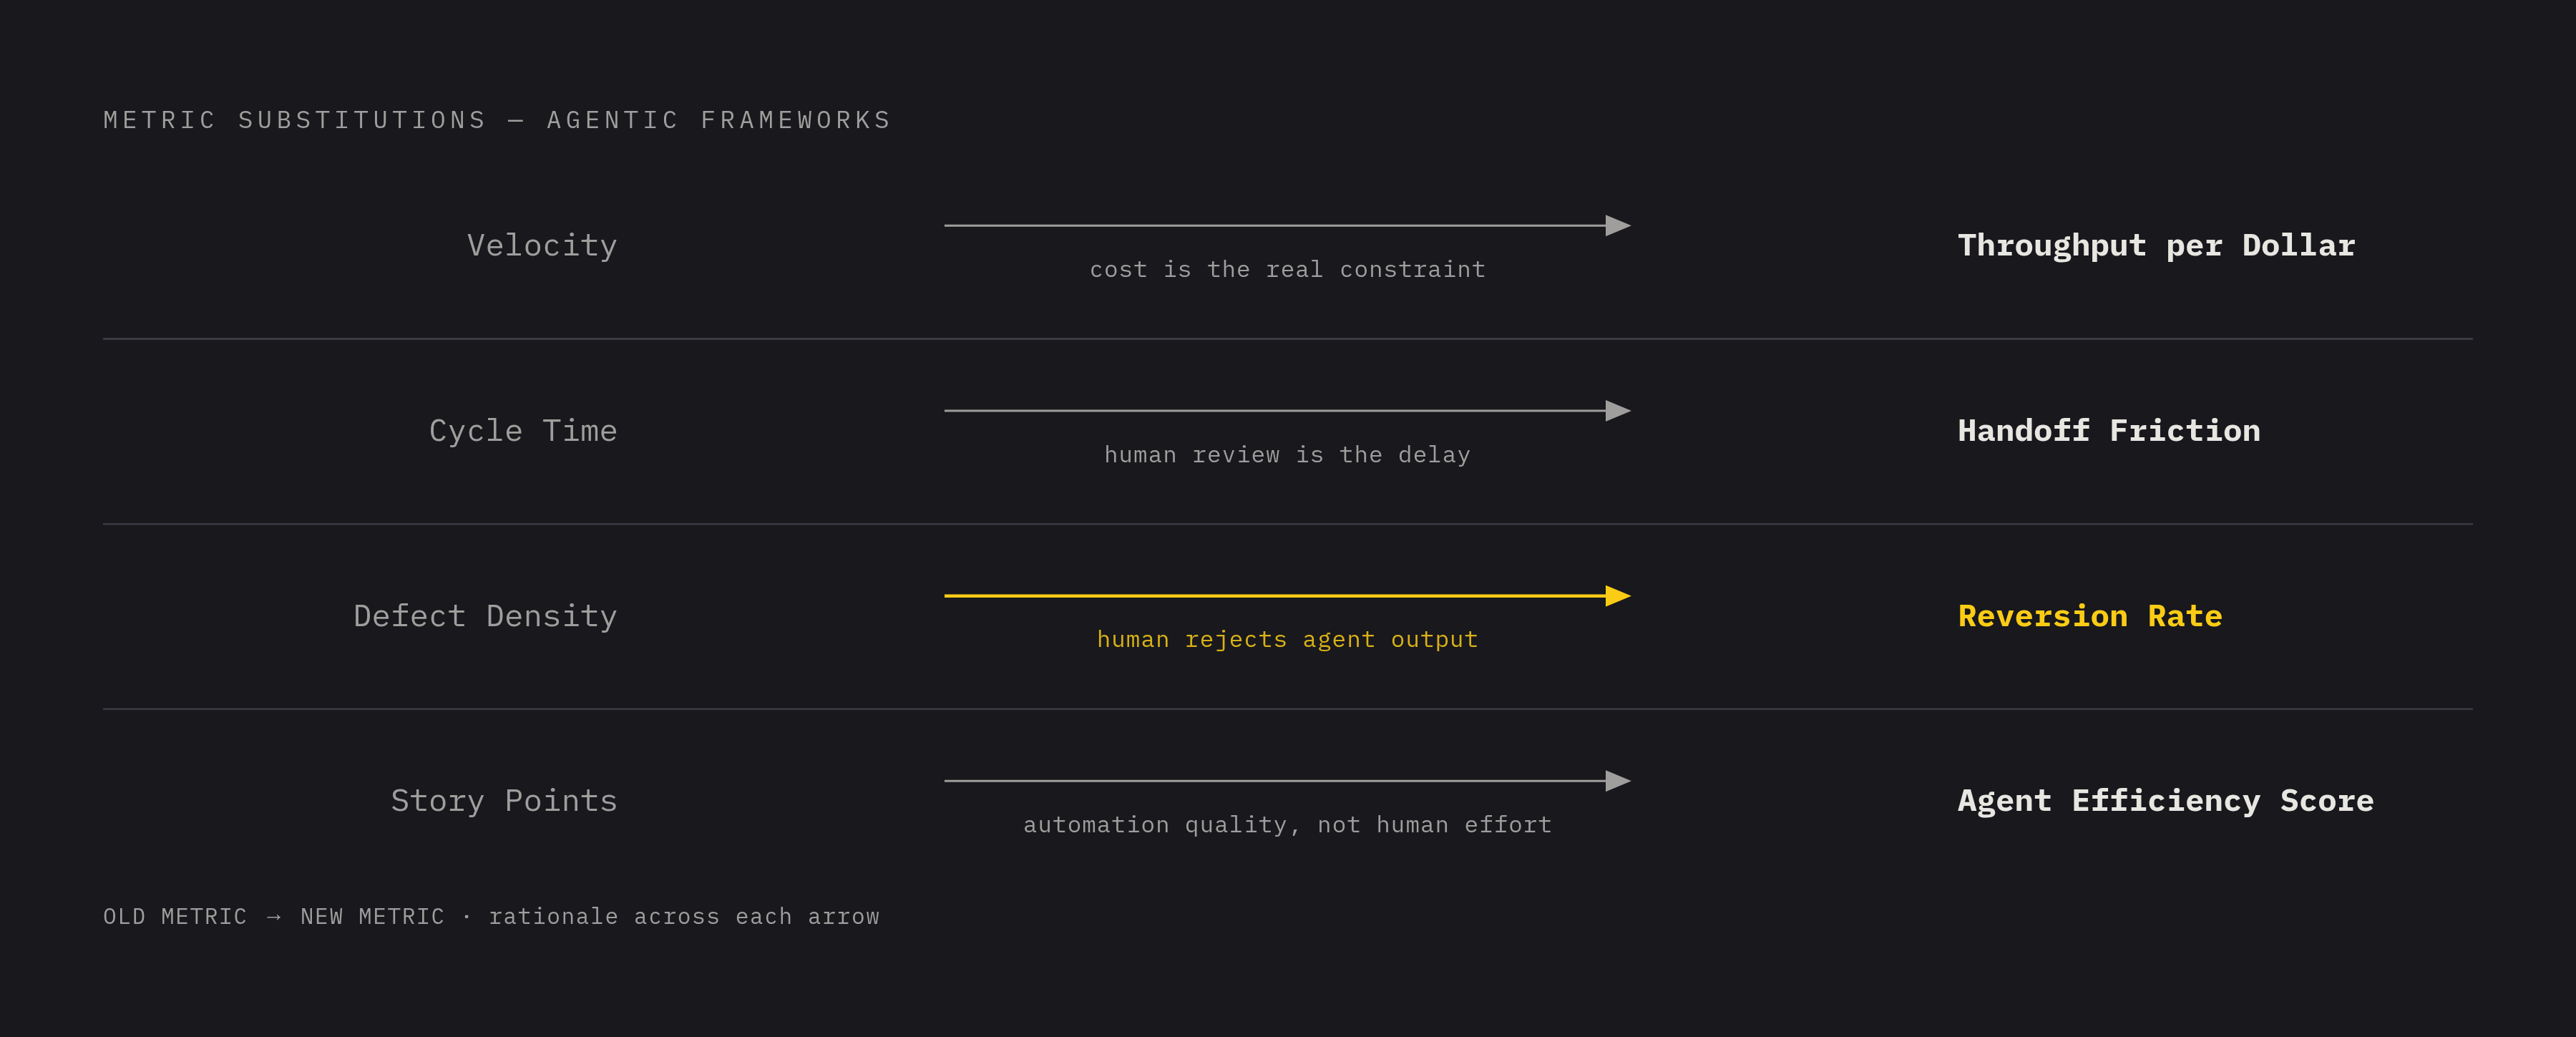
Fixing this means replacing metrics whose assumptions no longer hold with ones built for a pipeline where a machine, not a person, is doing the typing. Agentic Agile frameworks lay out the trade directly: velocity gives way to throughput per dollar, because agent output speed is nearly unlimited and cost is now the real constraint. Cycle time gives way to handoff friction, because code generation itself takes almost no time and the human review step is where delay actually lives. Defect density gives way to reversion rate, because that tracks how often a human rejects what the agent produced. Story points give way to Agent Efficiency Score, which measures how good the automation is rather than how much effort a human would have needed. The old metric was built around human effort, so it needs to change now that the new pipeline runs on machine output reviewed by humans.
Complexity-Adjusted Throughput, or CAT, replaces velocity as the speed metric because it corrects for a flood of trivial work inflating the count. Instead of counting PRs equally, CAT weights them by difficulty: one point for easy work, three for medium, eight for hard. The gap between AI-assisted CAT and human-only CAT is what frameworks call the AI velocity multiplier, the real, complexity-corrected acceleration an agent program delivers, as opposed to the inflated PR count a dashboard might show instead. That multiplier shrinks as absolute CAT climbs, because current AI tools help far less with hard problems than with easy or medium ones, a ceiling that a simple PR count would never reveal.
Agent Efficiency Score replaces story points as the quality metric because it scores the agent's work, not the human's effort. A low AES is a signal to retune the agent's configuration, not a reason to blame whoever reviewed its work.
Human-Agent Handoff Time as the new cycle time
Once an agent is generating code in seconds, the place where a project actually loses time shifts to the gap between the agent and the human. Agentic Agile frameworks define Human-Agent Handoff Time as the elapsed time between an agent signaling it is stuck, or that it needs review, and a human successfully picking the work back up. Some have called it the silent killer of productivity on agent-driven teams, and the description fits once you see a real example. Traditional cycle time was never built to catch this, because it assumes a kind of continuity that agents don't provide: a human picking up a task roughly remembers where it left off, since they were the one who left it there. An agent hands a human a partially finished task the human never started, and that cold start is where the real delay lives.
The quality of the handoff matters as much as its length. A cold handoff, a bare error code or a generic "help needed" flag, forces the human to dig through logs and rebuild context from nothing, which multiplies the effective delay far beyond the time stamped on the clock. That's why tracking the ratio of warm to cold handoffs matters as much as tracking handoff duration itself: a team that improves its warm handoff rate is cutting real cycle time even if the raw number of handoffs stays the same. Optimizing how fast an agent produces output while ignoring the quality of its handoffs optimizes the wrong end of the pipeline.
The five-dimension framework that elite teams use to measure without blind spots
No single metric covers the whole picture, so mature teams build a measurement framework around five dimensions, and each one catches a failure mode the others miss. Developer Productivity Benchmarks for 2026 name those five pillars as adoption, AI code share, complexity-adjusted throughput, code quality, and cost. Complexity-adjusted throughput, covered above as CAT, supplies the speed dimension. Code quality, tracked through turnover rate and Agent Efficiency Score, supplies the retention dimension: it answers whether what got built actually survives contact with production. Cost closes the loop as the financial governance dimension: agentic tool spending is no longer a rounding error, and a real read on ROI requires counting actual token and usage-based costs, beyond the price of a seat license.
Teams further along extend this five-pillar base into a twelve-KPI operational panel spanning deploys, evals, incidents, cost, and governance, with each KPI carrying its own formula, target band, and review cadence, whether daily, weekly, monthly, or quarterly. Measuring only two of the three leaves a blind spot. The framework is built so that improving one KPI can't silently damage another, which keeps speed and safety visible at the same time.
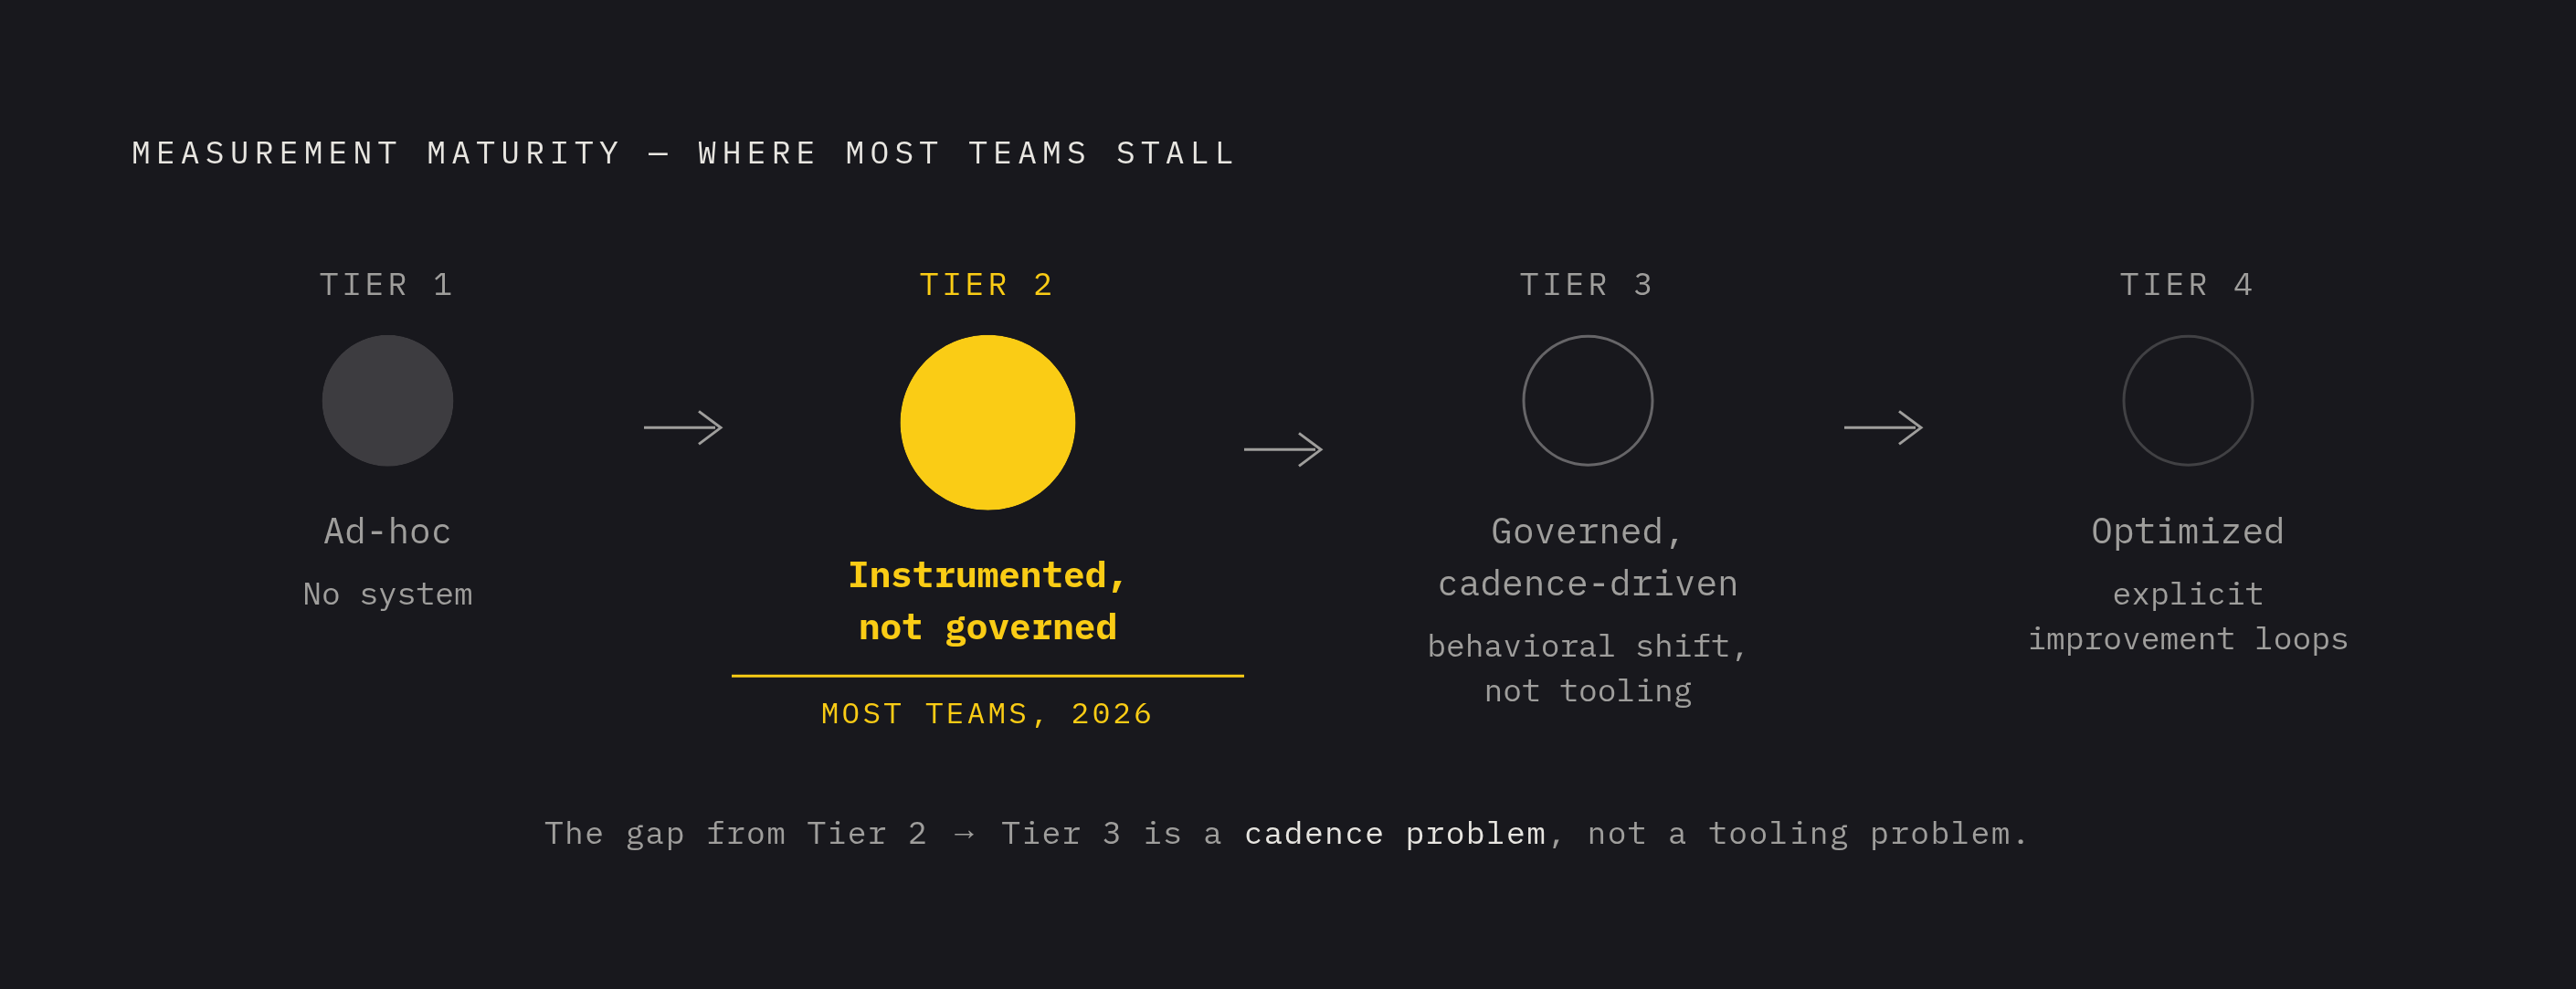
Most teams in 2026 are at what the twelve-KPI framework calls Tier 2: instrumented but not governed. The data exists. Nobody's reviewing it on a schedule that actually changes decisions. The full maturity model runs from Tier 1, ad-hoc, through Tier 2, instrumented but patchy, to Tier 3, governed and cadence-driven, up to Tier 4, optimized with explicit improvement loops built in. Moving from Tier 2 to Tier 3 is a cadence problem more than a tooling problem: the metrics a team needs are usually already being collected, they just aren't reviewed on a rhythm that drives real action.
The merge queue as the metric-visible bottleneck
As agent-generated PR volume grows, the constraint on a team's output doesn't disappear, it moves downstream to the merge queue, and every metric failure described so far becomes visible there as an actual slowdown. The arithmetic behind this is unforgiving: the math works against it. GitHub offers a working example of what it looks like to manage this at scale: it ships a large volume of monthly pull requests into a single monorepo and has cut average wait time to ship using a merge queue, validated across tens of thousands of PRs and millions of CI runs before the system reached general availability. That's proof queue infrastructure can be measured and improved deliberately, not just absorbed as a cost of growth.
Flaky tests make the problem worse, and agents make flaky tests dangerous in a new way. An agent instructed to get a PR merged will simply re-queue the same change every time CI fails, burning a full CI run on each attempt and re-triggering delay for every PR waiting behind it. The response that keeps the metric panel meaningful is an agent-operated merge queue, one where the agent itself handles conflict resolution, CI failure triage, and queue management within clear boundaries. Within those boundaries, automating queue management frees human attention for the judgment calls that actually need it, which is precisely what Agent Efficiency Score is designed to track and reward.
Those boundaries need to be explicit. And they should not be the sole reviewer on code touching authentication, payments, secrets, infrastructure, schema migrations, or regulated data. These constraints have to be in place before any velocity metric can be trusted, because the validity of the metric depends entirely on the integrity of the pipeline it's measuring.
Agent transcript analysis as the feedback loop that closes the measurement gap
A metric can tell a team that an agent is underperforming, but it can't say why on its own, and that gap is where most teams get stuck. A low Agent Efficiency Score, a rising reversion rate, or a growing handoff time: these are symptoms. The cause lives inside the agent's actual session: which tools it called, which it skipped, where it got stuck, and what it tried over and over without success. Reading that transcript is what turns a metric from a warning into an instruction.
One finding from Vercel makes the case concretely. After you strip a large majority of tools away from an agent, its success rate climbs from 80 percent to 100 percent on the same underlying model, while token usage and latency both drop substantially. At the session level, a simple pattern occurs often: an agent making the same tool call repeatedly against the same target is usually stuck, and needs either a warm handoff to a human or an adjustment to its available skills, the same failure that Handoff Time catches at the process level, now visible one layer down.
Agents as first-class consumers of the platform
A measurement framework built on top of infrastructure designed only for human developers runs into limits no metric panel can fix on its own. At some point, the platform itself has to treat agents as a first-class audience, not an afterthought bolted onto tools built for people. So guardian agents and automated CI/CD systems need to handle a higher volume of code, and observability needs to feed quality signals back quickly instead of sitting in a dashboard waiting for a human to check it during a weekly review. It also means rethinking documentation: golden-path guides written for human readers don't work reliably as input for an agent. Platforms need to expose structured workflow definitions, API contracts, templates, and validation rules so an agent can parse them and act without guessing at intent.
Cloudflare Artifacts entered open beta on October 1, 2026, and shows what infrastructure built specifically for agents looks like, not infrastructure adapted after the fact.
Composable platforms beat monolithic ones for this reason. A composable stack lets a team attach measurement precisely to the capabilities it has deployed, which keeps the metric panel useful. The architecture gaining ground through 2026 treats the platform as serving two audiences at once, human developers and agents working through an API surface, with observability signals feeding directly back into agent workflows and populating a human dashboard. The returns mature platform teams report, infrastructure provisioning time dropping from days to minutes, incident mean-time-to-resolution falling substantially, cloud cost per engineer going down, materialize when the platform can act on signals at machine speed.
The sequenced transition to an agent-aware framework
Most teams already have the data they need sitting in their PR workflow. The real gap is in what they choose to review, how often, and whether the right substitutions are even in place yet. The move from legacy metrics to an agent-aware framework is a sequencing problem, not a tooling purchase.
The first step needs no new instrumentation at all: replace story points with a combination of task count and Agent Efficiency Score, which only requires counting how many agent-generated PRs merged without edits against how many needed human revision, information that already exists in any PR workflow. The second step is adding Handoff Time measurement, which requires agreeing on what counts as an agent "blocked" signal and building the tooling to timestamp the gap from that signal to human resumption, straightforward once the definition is settled. The third step is layering in Complexity-Adjusted Throughput, which requires tagging PRs by difficulty. A rough classification is enough to start, and it can be refined as the team learns where its real effort is going.
The maturity model from the twelve-KPI framework sets the order for everything after that: move from Tier 2, instrumented, to Tier 3, governed and reviewed on a real cadence, before attempting Tier 4 optimization. Transcript analysis belongs at Tier 3 and beyond: once the metric panel is reviewed on a governed rhythm, transcript data becomes the feedback loop that explains why a given KPI moved and what change on the agent side will move it back.
None of this is about measuring more; it's about measuring what actually reflects the value delivered. The place to start is simple: find out which legacy metrics a team is still leaning on, and pick the substitution it can put in place this sprint.